Data scientists and engineers know that it's hard to validate and test data pipelines and models during build and in production. Monitoring and investigating issues is complex and time consuming. Etiq is here to help.
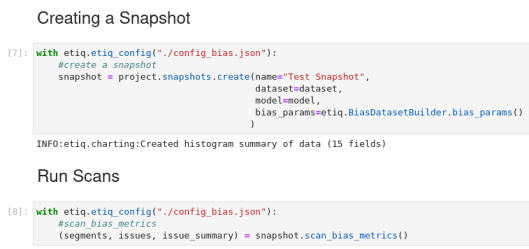
Etiq is a testing tool to test and monitor your data and models for issues like performance, drift, data issues, leakage and bias. With Etiq you will get fewer failures in your data and model pipelines, shorter debugging time, all while your team spends less time writing tests and setting-up monitors.
Interactive Demo
DATA ISSUES
Etiq has automated tests to help you test and monitor your data pipelines for multiple data issues that can make them fall over, or feed your feature stores incorrect information.
PERFORMANCE
Validate your models before deploying them and monitor them once they are live. With our root cause analysis functionality, find exactly what triggers the issue.
DRIFT
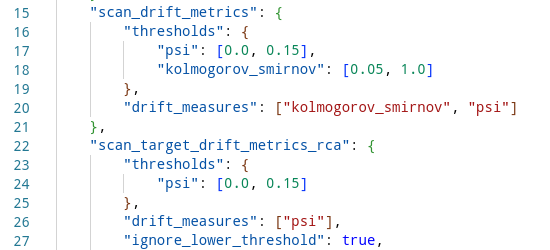
Your data and the world will change. The relationships your model encompasses will change. Completely tunable drift tests and monitors, data drift and concept drift with 5 out-of-the box metrics types, custom tests and root cause analysis.
BIAS & FAIRNESS
ML models can discriminate unintentionally and pose a compliance risk. Models perform better on some groups than others, leading to an overall underperforming system. Etiq has out-of-the-box bias tests developed in-house, root cause analyses and notebook templates for trickier fairness topics.
Time-to-value
15 minutes to install and set-up your first scan. Demo notebook templates for different model types. But don't take our word for it. Try it out with NO HASSLE: no sales calls, no demo calls, no credit card info required.

Deployment
pip install + one click on AWS Marketplace. Do you have a different cloud set-up? We'll ship you a container. To try it out: use our SaaS instance for easy due diligence on our tool.

Documented by default
We know documentation is a pain. All the snapshots and scans are documented by default in a config file.

Dashboard
Annoying to build from scratch but still relevant for everyone in the business. Etiq has you covered. Multiple chart types for each issue type and metric. Automatically surfaces the relevant chart for each issue. On the Workspace you can build via point and click a report with any combination of charts you need.

Privacy
No data, no problem. Our commercial tool is stored on your own cloud instance or on your premises. Our SaaS instance does not store any of your data, just test results.
We are supported by:
