Fairness is gameable: it all depends on the features (you pick)
Summary
Generally, fairness in machine learning is studied by concentrating on one sensitive attribute (feature), such as gender or race, at a time. Well-established group fairness metrics are used to reveal model discrimination against these sensitive groups. However, only looking at the data from one perspective can potentially miss important information. For example, a degree of prejudice towards females and black people might emerge through separate investigations, but what about the subgroup: black females; does this demographic experience greater discrimination than females or black people? If so, this needs to be uncovered. This is why intersectionality (the intersection of sensitive attributes) is such an important topic and requires more attention from practitioners. We take a look at it here by reviewing some previous studies, which outline new metrics for measuring intersectional fairness, as well as some repair methods designed to improve subgroup bias. In addition, an example dataset is analysed from multiple viewpoints, including an intersectional approach, to show how the fairness results can vary depending upon the perspective taken.
Introduction
Machine learning is widely used to guide decisions that affect individuals, such as whether a certain person will be approved for a bank loan. However, sometimes hidden bias within the machine learning model can influence these decisions, so that an individual may be negatively impacted. Such hidden biases are often attributable to membership of a particular group, such as groups defined by gender or race. Whether such an outcome is viewed as fair or unfair (legal or illegal) is dependent upon the business case for the machine learning model (the legislation of the jurisdiction), that is whether the outcome satisfies the requirements. If an individual who should have been treated the same as another, who only differs on attributes that are deemed non-essential (or proxies for them) for the business case, then the system is considered unfair.
Generally, the focus of fairness studies has been one sensitive variable (feature) at a time, such as examining bias from the perspective of gender or from the viewpoint of race. However, it is also important that practitioners include intersectionality in their work by intersecting various sensitive variables, resulting in the formation of subgroups. This is because these subgroups can potentially expose biases, which were previously hidden when attributes/features were considered in isolation. For example, intersecting gender and race could generate such subgroups as ‘black females’ and ‘white males’, and as a result, large disparities between these subgroups could emerge. The examination of fairness at the subgroup level is often referred to as intersectional fairness.
When only one sensitive attribute is the focus of the fairness study, there are a variety of well-established metrics that highlight group bias. These include the metrics referred to as demographic parity and equal opportunity, where demographic parity looks at the group probability of a predicted positive outcome (the positive prediction rate (PPR)), while equal opportunity calculates the group probability of a correctly predicted positive outcome (the true positive rate (TPR)). Another popular group metric is equalised odds, which is an extension of equal opportunity as it also evaluates the group probability of a correctly predicted negative outcome. Mehrabi et al. (2021) provide a survey of the various fairness measures.
It is necessary, however, to also have fairness metrics at the subgroup level in order to measure intersectional fairness. We explore this further here, as well as intersectionality in general, by firstly reviewing the relevant literature. Then, we examine the Adult dataset for bias, where initially we look at it from the viewpoint of gender bias, and then race, and lastly, from the intersection of the two, gender and race. The aim here is to demonstrate the variation in results obtained when analysing the data from different perspectives.
Previous Work
Through our review of the literature, we found that the number of publications discussing intersectional fairness was limited, and therefore, we would welcome further attention in this area from practitioners. Metrics for evaluating intersectional fairness is the main subject of the literature we review here. Buolamwini et al. (2018) helped establish this area of research by investigating subgroup bias in automated facial analysis using the prediction accuracy metric. The subgroups were generated by intersecting the sensitive variables: gender and skin-type. Their approach involved comparing the prediction accuracy of the four subgroups: darker-skinned females, darker-skinned males, lighter-skinned females and lighter-skinned males. As a result, it was found that darker-skinned females had the lowest accuracy, and lighter-skinned males had the highest accuracy, suggesting a large discrepancy in the model treatment of these subgroups.
Intersectional fairness metric at the subgroup level
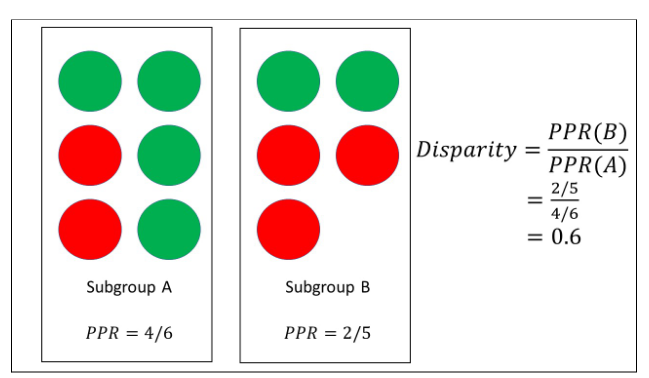
Figure 1: Subgroup A has 6 members, with 4 positive predictions (green) and 2 negative predictions (red), which could represent, say, the subgroup ‘white males’. Subgroup B has 5 members, with 2 positive predictions (green) and 3 negative predictions (red), which could represent, say, the subgroup ‘black females’. The positive prediction rate (PPR) for each subgroup is calculated, and the ratio of these two rates defines the subgroup disparity.
Another study that investigates intersectional fairness metrics is Ghosh et al. (2021), where well-known group fairness metrics are applied to define a new measure at the subgroup level. Firstly, they formed subgroups by intersecting sensitive attributes. Next, they defined an intersectional group fairness metric, which considered the differences between subgroups using known fairness metrics, including demographic parity or equal opportunity. Specifically, such measures as the PPR and TPR are calculated for each subgroup. From this, the ratio of the minimum and the maximum value was calculated e.g. PPR(subgroup A)/PPR(subgroup B), representing the worst-case scenario. This ratio is then used to indicate the level of disparity between the subgroups. For example, if it is close to 1, this suggests little disparity amongst the subgroups and conversely a ratio far from 1 signals a sizable difference between the subgroups. Hence, this metric provides a straightforward mechanism for identifying hidden biases at a subgroup level. A simple illustration of the disparity metric is given in Figure 1, where only two subgroups are considered and the PPR is computed for each subgroup. In this example, the ratio is relatively far from 1, and therefore, there are discrepancies between these groupings that should be addressed.
Intersectional fairness metric between any combination of subgroups
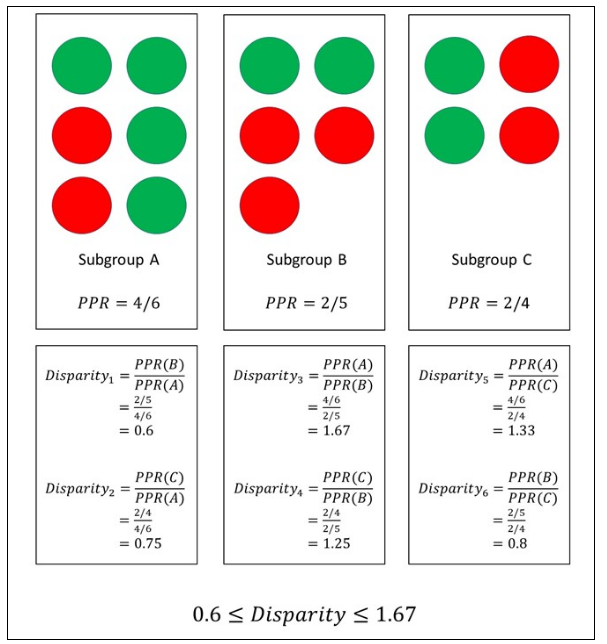
Figure 2: Subgroup A has 6 members, with 4 positive predictions (green) and 2 negative predictions (red). Subgroup B has 5 members, with 2 positive predictions (green) and 3 negative predictions (red). Subgroup C has 4 members, with 2 positive predictions (green) and 2 negative predictions (red). The positive prediction rate (PPR) for each subgroup is calculated, and the ratio of these two rates defines the subgroup disparities. All the possible combinations of the subgroups are considered to then determine the range for this set of ratios.
Similar to Ghosh et al., Foulds et al. (2019) propose a measure that focuses on the ratio of the model outcome probabilities for different subgroups, such as PPR(subgroup A)/PPR(subgroup B), which they call differential fairness. This approach, however, considers all the combinations of subgroups, meaning multiple ratios are computed. Then, the range of this set of ratios determines the degree to which subgroup fairness, in general, is upheld. The authors suggest that their definition of intersectional fairness is satisfied if the model outcome probabilities were roughly consistent (ratios always close to 1), irrespective of subgroup membership. An extension of the differential fairness metric outlined by Foulds et al., which only considers demographic parity, is presented by Morina et al. (2020). Here, the group fairness metrics, equal opportunity and equalised odds, are also incorporated into the fairness measure. Ratios for each of the fairness metrics are computed across the various subgroups. Again, the range of these ratios indicates the level of subgroup fairness achieved, according to the chosen metric. An illustration of the differential metric is portrayed in Figure 2, where three subgroups are shown and the PPR is calculated for each subgroup. The range for these ratios is [0.6,1.67]. Since we actually want these lower and upper bounds to be close to 1, these values suggest that some form of subgroup bias mitigation is required.
Algorithmic approaches to optimising for intersectional fairness criteria
Foulds et al. and Morina et al. also propose debiasing methods, which aim to improve a model’s intersectional fairness. Firstly, Foulds et al. train a neural network by minimising a loss function and an unfairness term to achieve a balance between accuracy and fairness. The inclusion of the unfairness term, which relates to their differential fairness measure, attempts to change the bounds on the subgroup ratios such that they move to as close to 1 as possible. Hence, the objective of this training method is to reduce the disparity between all the subgroups, whilst also attempting to improve model accuracy. Morina et al. outline a post-processing technique that redefines a prediction model, whilst trying to reduce subgroup unfairness. This entails the construction of a new model, which they call a derived predictor, which is dependent upon the original model response and subgroup membership. The parameters of the derived predictor are estimated through an optimisation problem that minimises the loss and an unfairness term associated with their definition of differential fairness and the chosen group metric. This technique, similar to Foulds et al., attempts to lower the disparity amongst the subgroups to a set threshold, using the subgroup ratios, whilst seeking to uphold model accuracy.
It is important to note that by intersecting two or more sensitive attributes, many subgroups might be formed, which can potentially result in subgroups with a very small number of individuals. Therefore, in this situation, it is advised that the statistical significance of the subgroups is assessed before being included in the analysis. For example, see Liu et al. (2012), which examines the clustering of high-dimensional, low-sampled data. In particular, they perform hypothesis testing to determine the statistical significance of the clustering using p-values. An alternative approach to address very small group sizes is the application of the Synthetic Minority Oversampling Technique (SMOTE), which involves duplicating examples from the minority group in the dataset in order to increase the group size.
In the following section, an example is given of how intersectionality can be addressed in practice, which should potentially be of great interest and guidance for practitioners going forward in this field.
Example: Adult Dataset
For this example, the Adult dataset is applied to build an income prediction model. Then, model metrics (accuracy, TPR and PPR) are computed from three different bias perspectives. Note that for each of these three cases, we define a different privileged group and unprivileged group in order to calculate the chosen metrics. Firstly, we examine the data for gender bias, and therefore set the privileged and unprivileged groups to ‘male’ and ‘female’ respectively. Next, the focus is racial prejudice with the privileged and unprivileged groups selected as ‘white’ and ‘black’ respectively (note that there are other types of race in the dataset). Lastly, the intersection of gender and race is considered, which forms four subgroups: (male, white), (female, white), (male, black), (female, black). From these four subgroups, we set (male, white) and (female, black) to be the privileged and unprivileged groups respectively. The results of this analysis are given in Table 1, where the privileged and unprivileged groups are indicated, as well as the disparity, which is the ratio of the unprivileged metric and the privileged metric. In addition, example code is outlined below that demonstrates the computation of the model metrics using the Etiq library when gender and race are intersected. We have chosen to intersect these two sensitive variables as black people and females can be vulnerable to discrimination, and therefore, we want to determine if either one of these groups is treated unfairly.
1# Import necessary modules
2from etiq_core import *
3import pandas as pd
4import numpy as np
5import matplotlib.pyplot as plt
6import seaborn as sns
7import warnings
8warnings.filterwarnings('ignore')
9%matplotlib inline
10etiq_login("https://dashboard.etiq.ai/", " ")
11our_project = Project(name="Intersectionality")
12# Load the adult data sample included in etiq
13data_adult = load_sample('adultdata')
14# Remove rows with missing values
15data_adult = data_adult.replace('?', np.nan)
16data_adult.dropna(inplace=True)
17# Combine two protected attributes
18def get_intersectionality_data(data, protected1, protected2):
19    column_name = protected1 + "_" + protected2
20    # combine the two protected features into a new column
21    data[column_name] = data[protected1] + "_" + data[protected2]
22    # remove the columns of the two protected features
23    data = data.drop([protected1, protected2],axis=1)
24    return data
25# Get the data containing new intersectionality feature
26data = get_intersectionality_data(data_adult, "gender", "race")
27xgb = DefaultXGBoostClassifier()
28# Set your own combination of privileged/unprivileged
29def get_debias_params(protected, privileged, unprivileged):
30    return BiasParams(protected=protected, privileged=privileged, unprivileged=unprivileged,
31                      positive_outcome_label='>50K', negative_outcome_label='<=50K')
32# Select continuous and categorical variables
33cont_vars = ['age', 'educational-num', 'fnlwgt', 'capital-gain', 'capital-loss', 'hours-per-week']
34cat_vars = list(set(data.columns.values) - set(cont_vars))
35debias_params = get_debias_params("gender_race", "Male_White", "Female_Black")
36
37transforms = [Dropna, EncodeLabels]
38dl = DatasetLoader(data=data, label='income', transforms=transforms, bias_params=debias_params,
39                   train_valid_test_splits=[0.8, 0.1, 0.1], cat_col=cat_vars,
40                   cont_col=cont_vars, names_col = data.columns.values)
41metrics_initial = [accuracy,  equal_opportunity,demographic_parity, equal_odds_tpr, equal_odds_tnr,
42                   true_neg_rate, true_pos_rate, individual_fairness, individual_fairness_cf]
43pipeline_initial = DataPipeline(dataset_loader=dl, model=xgb, metrics=metrics_initial)
44pipeline_initial.run()
45pipeline_initial.get_protected_metrics()
46 | Baseline | |||||||||||
| Priv. | Unpriv. | Disp. | Priv. | Unpriv. | Disp. | Priv. | Unpriv. | Disp. | |||
| Metrics | Male | Female | White | Black | Male, White | Female, Black | |||||
| Accuracy | 0.84 | 0.93 | 1.11 | 0.86 | 0.94 | 1.09 | 0.82 | 0.96 | 1.17 | ||
| TPR | 0.69 | 0.55 | 0.80 | 0.67 | 0.67 | 1.00 | 0.67 | 0.56 | 0.83 | ||
| PPR | 0.29 | 0.09 | 0.31 | 0.23 | 0.11 | 0.48 | 0.29 | 0.04 | 0.14 | ||
Table 1: Accuracy, true positive rate (TPR) and positive prediction rate (PPR) are shown for the Adult dataset, where the focus of bias detection is on gender (yellow), race (pink), and the intersection of gender and race (green).
Table 1 demonstrates the variation in the results observed when viewing metrics from different standpoints. Firstly looking at the gender results, a sizable disparity amongst males and females in terms of TPR and PPR is revealed. However, from the viewpoint of race, there is no bias found in the TPR metric, whilst there is some according to PPR, although this is not as low as that identified in the case of gender. For the intersection of gender and race, a disparity in TPR is observed that is of a similar size to when gender is considered in isolation. Since no bias is detected in the case of race, the TPR discrepancy found when intersecting could be attributed to gender alone. In contrast, the intersectional PPR signals the largest disparity in all the cases seen, which is potentially due to combining gender and race such that the disparity at the subgroup level is amplified.
We also applied a resampling technique to the Adult dataset in an attempt to improve fairness amongst the user-defined privileged and unprivileged groups. However, across the three scenarios, we observed very mixed results, where the effectiveness of the debiasing tool was shown to be largely dependent upon the viewpoint taken.
Conclusion
We have investigated the intersection of sensitive attributes to generate subgroups, and the potential biases this can expose at a subgroup level. Firstly, previous studies that explored intersectionality were outlined. More precisely, some of these publications presented new intersectional fairness measures, as well as repair methods for improving a model’s subgroup fairness. Next, the Adult dataset was examined for bias from three viewpoints: gender bias, race and the intersection of gender and race. This analysis revealed that when viewing the problem from different standpoints, a sizable variation in results is observed. In particular, the largest disparity occured when gender and race were combined, suggesting the importance of an intersectional perspective. Hence, this work highlights the need to look at your data from contrasting perspectives, where multiple sensitive attributes should be considered, including their intersections.
References
Buolamwini, J. and Gebru, T., 2018. Gender Shades: Intersectional Accuracy Disparities in Commercial Gender Classification. Proceedings of the 1st Conference on Fairness, Accountability and Transparency, In Proceedings of Machine Learning Research, 81:77-91.https://proceedings.mlr.press/v81/buolamwini18a.html
Foulds, J. R., Islam, R., Keya, K. N. and Pan, S., 2020. An Intersectional Definition of Fairness. IEEE 36th International Conference on Data Engineering (ICDE), 1918-1921,https://ieeexplore.ieee.org/document/9101635
Ghosh, A., Genuit, L. and Reagan, M., 2021. Characterizing Intersectional Group Fairness with Worst-Case Comparisons. Proceedings of 2nd Workshop on Diversity in Artificial Intelligence, In Proceedings of Machine Learning Research, 142:22-34.https://proceedings.mlr.press/v142/ghosh21a.html
Liu, Y., Hayes, D.N., Nobel, A. and Marron, J.S., 2012. Statistical Significance of Clustering for High-Dimension, Low–Sample Size Data, Journal of the American Statistical Association, 103:483, 1281-1293,https://doi.org/10.1198/016214508000000454
Mehrabi, N., Morstatter, F., Saxena, N., Lerman, K. and Galstyan, A., 2021. A Survey on Bias and Fairness in Machine Learning. ACM Computing Surveys, 54(6):1-35.https://dl.acm.org/doi/pdf/10.1145/3457607
Morina, G., Oliinyk, V., Waton, J., Marusic, I. and Georgatzis, K., 2020. Auditing and Achieving Intersectional Fairness in Classification Problems.https://arxiv.org/abs/1911.01468